
It is mid July 2022. We are currently experiencing a significant – at the time of writing provisionally record-breaking – heatwave for the UK. Red weather warnings for extreme heat are in force for large parts of England and forecasts indicated a real possibility of temperatures reaching up to 40°C in some areas. Indeed, this temperature has already been exceeded. Whether or not records are broken, a key part of the work that we do at the Met Office is climate monitoring, an important aspect of which is the ability to put current weather into historical context. Climate monitoring serves many functions: It can effectively communicate the relative severity of an event; it can indicate how frequently such extremes are likely to occur; and it can monitor how the character or frequency of extremes are changing over time. In order to properly understand the risks from climate change, a key research question climate monitoring can help us to answer is, ‘What are the current weather and climate hazards, risks and impacts that should be expected in the UK and globally?’. To address this question, we must look to the past, and the scientific effort goes back further than you might think.
Making history
In 1663, Robert Hooke stood before the relatively newly formed Royal Society and proposed ‘A method for making the history of the weather’. Hooke and other notable scientists of the time were actively developing instruments capable of making meteorological measurements of wind, rain, air pressure, humidity and temperature. These were the early anemometers, rain gauges, barometers and thermometers of the time1. In his paper, Hooke recommended what should be measured and how it should be recorded, including ‘a scheme at one view representing to the eye the observations of the weather for a month’ and implored his colleagues to undertake such measurements. From a modern climatologist’s point of view, arguably one of the most important advances by Hooke was his recognition that if systematic and consistent measurements were made across the country, or even across the world, then an international perspective on the weather could be obtained, for the benefit of humankind.

Image reproduced from the Royal Society Wilkins Lecture (1950): https://royalsocietypublishing.org/doi/pdf/10.1098/rspa.1950.0071

Image shows a climatological report from Reading University in 1935, showing many similarities to Hooke’s original scheme. (Met Office Archives)
Unfortunately for Hooke, he never saw the realisation of this idea and it was nearly 200 years before such national and international networks came into being in the middle of the 19th century, at around the time the Met Office itself was established. However, the climatologists of today remain hugely thankful to Hooke and his contemporaries’ pioneering work and the work of all those that followed, which heralded in the era of instrumental measurements of the weather. Their work has meant that we have been able to construct instrumental climate records spanning over 350 years for the UK, and global records spanning over 150 years.
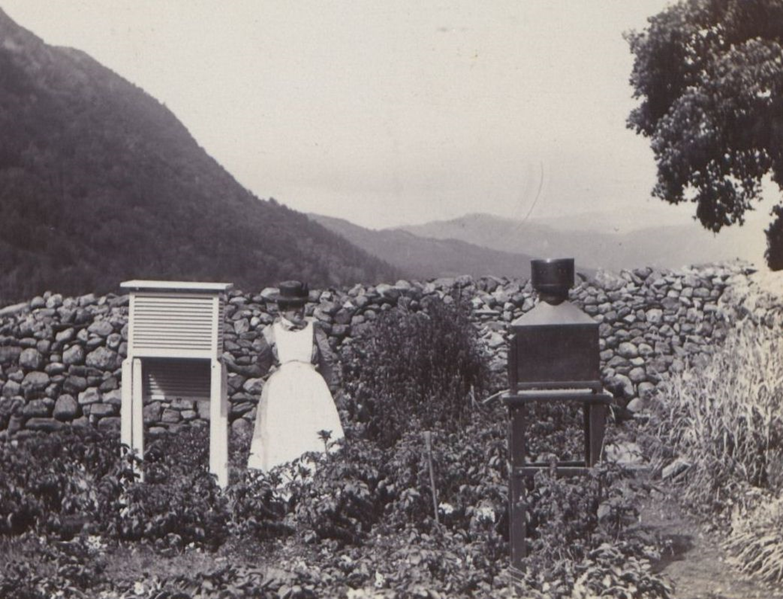
Image: Measuring the weather in Seathwaite, Cumbria 1899 (Met Office Archives)
Data digitisation
All of these meteorological measurements have been made over centuries by a huge army of observers across all walks of life. Many of these people may not have been aware that every one of their observations would be so valuable hundreds of years later. Thankfully for science, many of the original documents have been carefully looked after by archivists, including at the Met Office. The digital age is relatively new in comparison and turning centuries of handwritten weather records into data that can be used by a computer is no small feat.
Data recovery projects are a valuable contribution to modern climate science, releasing data from paper archives and making them available to modern analysis. The sources are varied, from arctic explorations to early weather observers. A recent project led by Professor Ed Hawkins at the University of Reading in collaboration with Met Office, asked the public to help digitise over five million historical UK rainfall observations dating between 1677 and 1960. The project launched at the start of the first COVID-19 lockdown in the UK, and the response from the public was incredible, completing the whole activity in just 16 days. The resulting data has already re-written some of our climate history books, with 1855 now holding the title of driest year on record.
The granularity of the data also means we can explore some regional extremes. For example, Cumbria experienced two exceptionally wet months in November 2009 and December 2015. Thanks to the years of data, we can now put this into an even longer historical context to see that the only other month to come close in over 180 years was November 1852 – an exceptionally wet month for England, during which flooding disrupted the Duke of Wellingtons’ funeral procession.

Image: Monthly rainfall for Cumbria 1836-2021 highlighting the extreme wet months in 1852, 2009 and 2015. (Source: Met Office)
The same is true for heatwaves, with the existence of climate records spanning in some cases well in excess of 100 years, allowing us to capture the most extreme heat events from the past. The recovery of historical measurements has allowed us to place over 100 years of summer heatwaves into context. While the heatwaves of 1976 and 1995 are still in living memory, thanks to our climate archives we also know that the summer of 1911 saw a stand-out heatwave. The temperature reached 36.7°C on 9 August that year, a UK high temperature record that stood for nearly 80 years until 37.1°C was reached on 3 August 1990. That temperature has been met or exceeded another four times since this date.

Image: Top ten hottest days on record based on highest maximum temperature. (source: Met Office)
Understanding our climate
Climate change is a global issue, and therefore it is also imperative that we are able to monitor changes across the world. Major national and international collaborations have collated international observations data from land, ice and oceans to track the world’s changing climate. These datasets not only broaden our understanding of climate change, but also our chances of achieving global aims such as the Paris Agreement “to strengthen the global response to the threat of climate change by keeping a global temperature rise this century well below 2 degrees Celsius above pre-industrial levels and to pursue efforts to limit the temperature increase even further to 1.5 degrees Celsius.”
Huge progress has been made in building global temperature datasets covering the mid-19th century onward, so we can say that the 2021 was over 1°C warmer than a pre-industrial baseline. Climate monitoring is, however, not limited to temperature and rainfall. A wide range of essential climate variables covering land, oceans, atmosphere and the cryosphere are routinely monitored. In all cases, digitisation and further data recovery activities continue to improve our understanding of the climate of the past, which in turn helps us understand the risks from the present and future climate change.
Via Source link
0 comments:
Post a Comment